Richest Cities in Hawaii (2025)
by Kristen Carney ![]()
Updated: December 17, 2024
Richest City in Hawaii
The richest city in Hawaii is Makena in Maui County with an average household income of $331,340 as of 2023. While exceptionally affluent, Makena only has a population of 118 as of 2023. The richest city in Hawaii with at least 5,000 people is Heeia in Honolulu County with an average household income of $203,047 as of 2023 and 5,099 people as of 2023 according to the most current Census data available (citation).
| Rank | City | County | Population | Average Income | Median Income |
|---|---|---|---|---|---|
| 1 | Makena | Maui | 118 | $331,340 | $188,750 |
| 2 | Kapalua | Maui | 392 | $279,636 | $152,292 |
| 3 | Makaha Valley | Honolulu | 161 | $241,383 | $161,000 |
| 4 | Puako | Hawaii | 302 | $237,832 | $116,250 |
| 5 | Poipu | Kauai | 1,418 | $228,643 | $138,864 |
| 6 | Kaanapali | Maui | 1,216 | $225,430 | $134,375 |
| 7 | Maunawili | Honolulu | 2,288 | $217,526 | $176,528 |
| 8 | Launiupoko | Maui | 669 | $205,078 | $148,333 |
| 9 | Heeia | Honolulu | 5,099 | $203,047 | $160,294 |
| 10 | East Honolulu | Honolulu | 50,961 | $200,719 | $158,398 |
| 11 | Kailua CDP | Honolulu | 39,762 | $178,412 | $146,615 |
| 12 | Mahinahina | Maui | 1,051 | $176,111 | $161,875 |
| 13 | Captain Cook | Hawaii | 3,751 | $172,739 | $124,551 |
| 14 | Napili-Honokowai | Maui | 6,897 | $170,658 | $102,337 |
| 15 | Waimanalo | Honolulu | 5,634 | $169,209 | $114,896 |
| 16 | Olowalu | Maui | 70 | $166,424 | $108,250 |
| 17 | Wailea | Maui | 6,571 | $163,597 | $89,375 |
| 18 | Keokea | Maui | 3,049 | $160,309 | $119,464 |
| 19 | Ko Olina | Honolulu | 1,677 | $156,813 | $125,577 |
| 20 | Aiea | Honolulu | 9,155 | $156,555 | $135,286 |
Median Income versus Average Income: Which Should You Use?
We usually suggest using median income data – either instead of or in addition to – average income data as a true indicator of wealth. If you haven’t thought about median versus average since your last standardized test, you aren’t alone. Here’s what they are:
- average is the sum of a set of numbers divided by the count of numbers in the set
- median is the middle number in the set of numbers
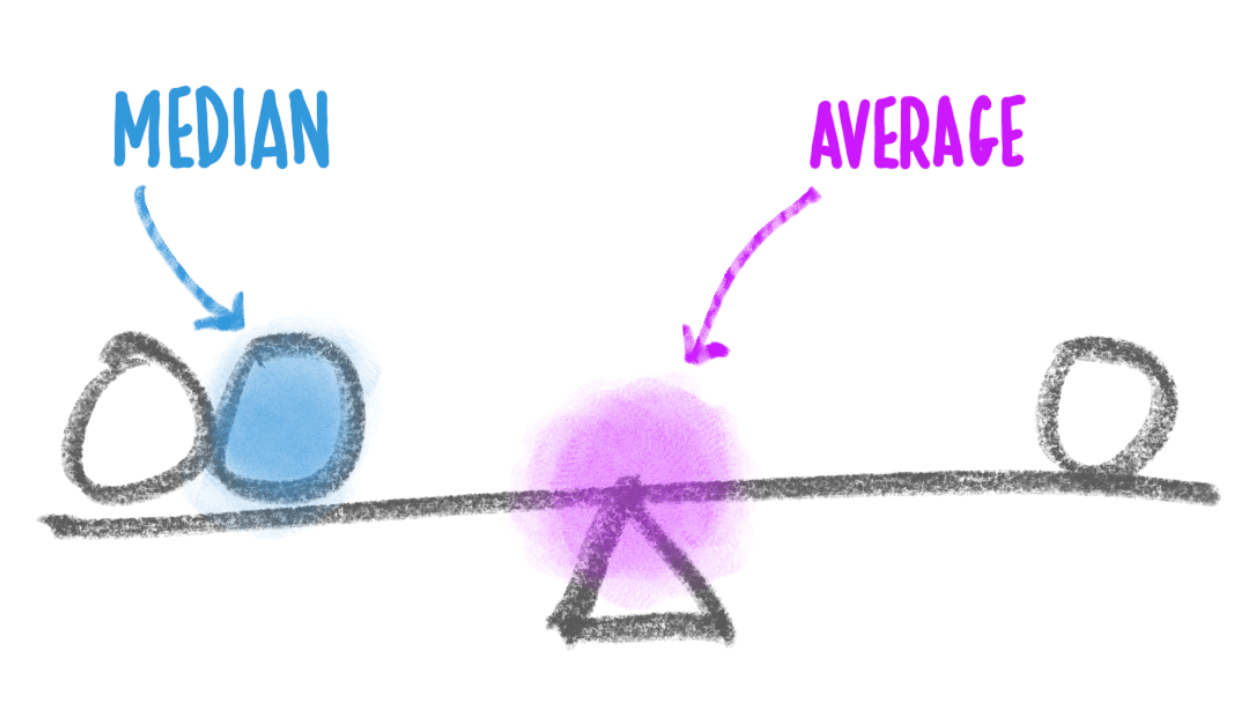
Now let’s say you had the following simplified set of income data.
Household 1: $30,000
Household 2: $50,000
Household 3: $1,000,000
The average income for this set is $360,000. The outlier data point ($1,000,000) skews the average WAY up. Conversely, the average income would be skewed WAY down if someone had an income of $500. The median income for the same data set is $50,000. Outlier data doesn’t skew the median.
Most Business Owners Should Use Median Income
So most business owners should use the median income as a true indicator of wealth, because it provides a more accurate representation of a typical income, especially in areas with significant income disparity.
When Should You Use Average Income
If your target market is high-income households, the average income may be more relevant. This is because the average income can highlight the presence of a higher concentration of wealthy individuals, which is beneficial for luxury goods and services marketing. We’re using average income on this page because using the Census’s highest reported median value of $250,001 could result in multiple ties for the richest geography.
Why do so many cities have a median value of $250,001?
The Census' American Community Survey uses $250,000+ as a jam value for median income estimates to protect privacy, ensure data consistency, and simplify reporting. A "jam value" in survey data refers to a placeholder or default value used when actual data points are unavailable, incomplete, or exceed certain thresholds. We represent this jam value as $250,001 to make it easy for you to sort.
You might also be interested in:
Email Me When New Data Are Released
Join thousands of subscribers and receive just 1 (ONE!) email a year in December when the US Census Bureau releases new income data for Hawaii richest cities.
SOURCES
United States Census Bureau. Annual Estimates of the Resident Population: April 1, 2020 to July 1, 2023. U.S. Census Bureau, Population Division. Web. May 2024. http://www.census.gov/.
United States Census Bureau. B01001 SEX BY AGE, 2023 American Community Survey 5-Year Estimates. U.S. Census Bureau, American Community Survey Office. Web. 12 December 2024. http://www.census.gov/.
United States Census Bureau. B19013 Median Household Income, 2023 American Community Survey 5-Year Estimates. U.S. Census Bureau, American Community Survey Office. Web. 12 December 2024. http://www.census.gov/.
United States Census Bureau. “DP03 SELECTED ECONOMIC CHARACTERISTICS.” 2023 American Community Survey 5-Year Estimates. U.S. Census Bureau, American Community Survey Office. Web. 12 December 2024. http://www.census.gov/.
Products & Services
Plumbing
Connect
- 1-800-939-2130
- Contact Us
© Copyright 2025 Cubit Planning, Inc.